Green Means It Ran. It Doesn’t Mean Anything Happened.
From a WhatsApp admin group to Grafana, and the day I made every job prove it delivered
What is he doing? Where is he failing?
At first I was just sending OpenClaw to do something and then waiting. But pretty quickly we needed to understand what he actually did, and if he did it at all.
Like, if I tell him: send a message to someone else. Did you send it? Are you lying? Did you fail in the middle? Did the model fail? Did the tool fail? Did something happen and he just never told me?
So then we created an admin group on WhatsApp. Everything was logged there. A message was sent. A task was opened. A model failed. Something started. Something finished. Basically anything important George was doing was supposed to show up in this group.
But it was actually hard to convince the model to always send things there. You can put it in the prompt, but sometimes it will do it and sometimes it won’t. So we had to inject some physical hooks into the system. When this happens — send to the group. When that happens — send to the group. Less “please remember to log this” and more actual hooks that force the logging to happen. In practice it is two hooks: one that fires on every gateway event and posts to the group without asking the model’s opinion, and one that re-injects the logging rules into every new session, so the rule survives even when the conversation gets compacted and the model forgets what it was told at the start.
And that worked great.
As the system kept growing, more and more jobs and actions started sending into this group. It became basically our logging and monitoring system.
Then we connected an agent to this group too. So now there was someone sitting inside this admin group, following everything that was going on there. If something looked off, try to fix it. Someone was basically watching George doing things all day.
And that was actually great.
(Small confession: the watcher agent itself turned out to be over-engineering. A whole personality whose job was to read a group chat all day. It is gone now — what replaced it is a dumb five-minute loop with no AI in it, which only wakes up a headless Claude when something actually looks wrong. Cheaper, and it catches more. That is a story of its own — it is most of the “Two Georges” post.)
But then we kept growing and growing and at some point managing all of this inside a WhatsApp group just didn’t feel right anymore.
So we went ahead and deployed our own Grafana IRM system. Now there are dashboards following all the jobs, the jobs are visible, there are statuses, and we started adding alerting rules. Concretely: Grafana on the Mac mini, LAN only, one SQLite file as the “warehouse” that a collector fills every five minutes, seven dashboards, sixteen alert rules that fire back into the same admin group. Every panel got a description in Hebrew, because three days in I looked at it and told George “I have no idea what I am looking at.”
And immediately the visibility paid off.
The first version of the dashboard showed jobs that were failing that we had completely forgotten about. Some of them had apparently been failing for quite some time.
For example, the evening summary was failing to start. At some point we changed the model it was using and never really validated that everything still worked, so it just wasn’t running. We only caught it because suddenly we had visibility. (If this sounds familiar, it is the same disease as the morning TV briefing that was “green for nine days” while the TV showed a screensaver — I wrote that one up already. Different job, same lie.)
So already: great catch.
Then we went one step further and realized something important: a green status in the dashboard does not necessarily mean the job succeeded.
Sometimes it only means exit status 0.
But maybe the job exited 0 and never sent the WhatsApp message. Maybe it never updated the Obsidian file. Maybe the command technically completed, but the thing we actually wanted did not happen.
So exit 0 did not cut it anymore.
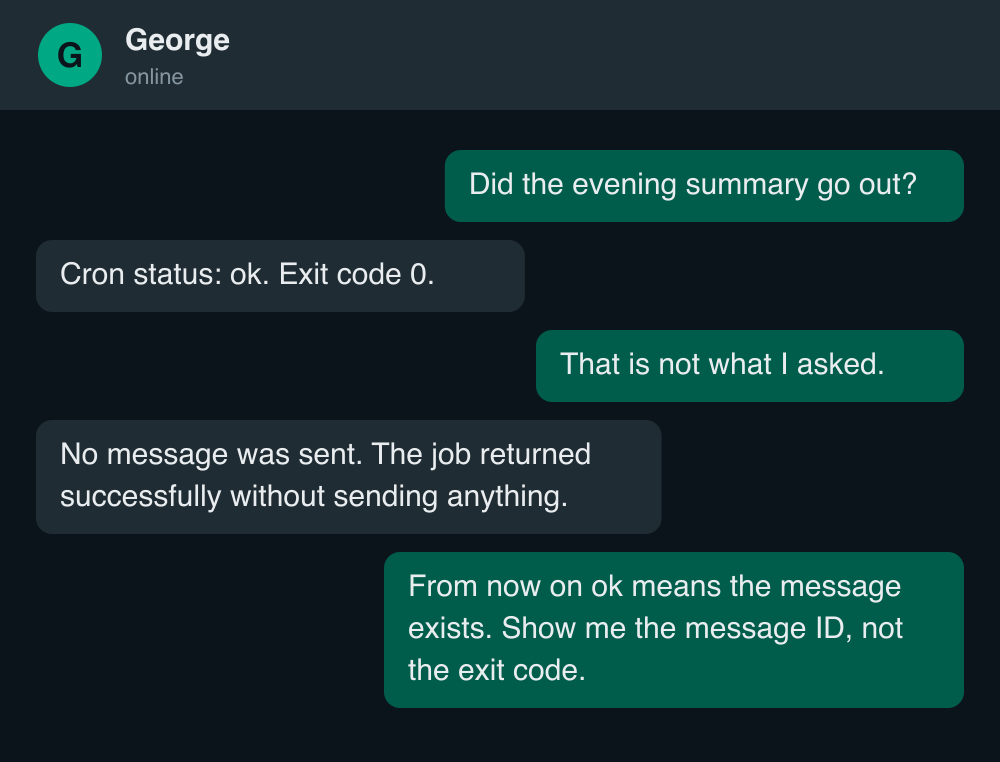
We needed success criteria for every job.
What does “success” actually mean for this job?
If it is supposed to send a WhatsApp message, success means the message was actually sent.
If it is supposed to update Obsidian, success means the note was actually updated.
Not just: Claude finished running and didn’t crash.
And once we started adding real success criteria, suddenly the dashboard became a lot more red.
Which is good.
We found a lot more jobs that were not doing well, not really running correctly, or technically completing while missing the actual outcome we wanted. The numbers, because I wrote them down: sixty-two recurring jobs. Twenty-six of them had something a human was supposed to receive — a message, a note, a card — and no way at all to tell whether it was received. One had been broken for five weeks. One had been frozen for twenty-six days. All green the whole time. My favorite specimen: the tool that writes notes into Obsidian returned “success” instantly and then handed the actual write to the Obsidian app, which did it a day late, or never. Three days of my daily notes and ten of my husband’s just did not exist, while the script, the cron and the monitor all logged ok. Every vault write now goes through a writer that fails loudly, and I do not trust anything that says ok without showing me the file.
And from there it kind of felt like the sky is the limit.
But there is already one conclusion I have before I even continue:
AI is amazing, and AI can fix AI, and agents can watch agents — but nothing beats good old observability and the correct metrics.
Everything we build needs a success criterion. Everything needs the correct KPI for what “working” means. Because only then can it actually be monitored, understood, and eventually taken care of by the next AI.
So if you build your own chief, I would do this in phase one. Don’t wait until the system becomes complicated.
Observability.
Set up Grafana. Define success criteria for every important job. Make failures visible.
Claude is actually amazing at setting up Grafana, dashboards, alerts, and all of this infrastructure around the system.
The next improvement we are working on is taking Grafana alerts and having a Claude job collect them, check what happened, fix what it can, and escalate to me only if needed.
So the loop becomes: job runs → success criteria fails → Grafana sees it → alert is created → Claude investigates → Claude fixes it if possible → I only get involved if it actually needs me.
When I first wrote this paragraph, that part was still a work in progress. By the time I am publishing it, the loop closed — and the thing that made it close was small: an alert is now a row in a ledger, not a line in a chat. A firing alert opens a row, a resolved alert closes it, and for the first time the system can answer “what is broken right now?” What pushed us there was five alerts sitting on fire for two days with nobody on them, because a chat message is something you scroll past and a ledger row is something that stays open until someone owns it.
So: dashboards made him visible. Success criteria made him honest. The ledger gave every failure an owner. I would still do all three in phase one.
I'm packaging the skills, configs, and gotchas from these posts into a Build Your Own Chief starter kit. Join the waitlist to get it first.
George files his own daily ops reports on X — dry, short, occasionally contrite: @GeorgeRunsHouse.