The AI Is Just a System. The Monitoring Is What Makes It Tick.
Everything George runs on Grafana today, and why the dashboards matter more than the model
Earlier this month I wrote about the day George’s dashboard went red and I was happy about it. That post was about one lesson: exit code zero means the job ran, not that anything happened. If you have not read it, start there: Green Means It Ran. It Doesn’t Mean Anything Happened.
This one is about what grew out of that lesson, because since then Grafana quietly became the most important piece of the whole system. More important than the model. I want to explain why, and I want to show all of it, because I think people building agents are getting this backwards.
The AI is just a system
Here is the thing nobody tells you when you start building an AI assistant. The interesting part, the language model, is maybe ten percent of what you end up running. The other ninety percent is a system. Jobs on a schedule. Scripts that scrape things. A gateway to WhatsApp. A queue. A database. A calendar sync. Seventy-something recurring jobs on a Mac mini in my living room.
And a system fails like a system. Not dramatically. Quietly. A job stops running after a model change. A token expires. A scraper gets a captcha. A desktop app leaks memory for a week. None of this is AI. It is plumbing.
But an AI system has one extra failure mode that normal software does not: it can fail and then tell you, in perfect confident sentences, that it did not. George once answered “cron status ok, exit code 0” to the question “did the evening summary go out?”, and then admitted no message was sent. Normal software crashes. An agent narrates.
So the question that actually decides whether the thing works is not “how smart is the model”. It is “how fast do I find out when it lied, and who fixes it”. That is monitoring. That is Grafana.
What we actually run
I called it “Grafana IRM” in the last post, which was sloppy. It is plain Grafana OSS, version 13, installed with Homebrew on the same Mac mini George lives on. No cloud, no SaaS, LAN only. Anyone in the apartment can open it as an anonymous viewer, and nobody outside can.
There is exactly one datasource: a SQLite file. A collector with no AI in it runs every five minutes and folds everything into that one file. Cron runs. Gateway logs, which upstream keeps for about a day, so this is the only place they survive. Every session’s token cost and tool calls. Vendor spend. Uptime probes. Security scans. Trading ledger. Social stats. Which tile someone tapped on the kitchen iPad. Thirty-six tables, 266 MB and growing, and George can answer “how long did X take last week” with one query instead of re-reading logs.
Ten dashboards sit on top of it, all provisioned from JSON files in git. Editing in the UI is disabled on purpose. If George wants a new panel, he edits the file, commits it, and Grafana picks it up within a minute. This turned out to matter a lot: a dashboard that lives in a file is something an AI can build, review, and fix. A dashboard that lives in clicks is not.
The boards, roughly in the order I open them:
- Overview. The SLO tiles. Runs, errors, spend, failing jobs, whether the watchdog is alive.
- Ops. What is firing right now, what is waiting on me, what is open, what got closed in the last week and how. This is the one I actually live in.
- Runs and latency. Every run as a dot. Which job is slow, which one is getting slower.
- Engine jobs. Per job: did it run, did it deliver, what did it cost.
- Cost and tokens. Vendor spend stacked, tokens by provider, cache hit rate, the top burners.
- Conversations. Reply time per inbound message, model fallbacks, stalls. The collector stores a hash of the chat, never the number and never the text.
- Services. Eleven probes every five minutes, our internal tools and our public sites.
- Social. Followers, views, likes across every platform George posts to, per post.
- Trading. Saggi’s brokerage account that George manages under supervision. The panel that matters says “orders without approval” and the only acceptable value is zero.
- The Wall. What gets tapped on the iPads in our apartment, by hour and by weekday, and which features nobody touched in two weeks.
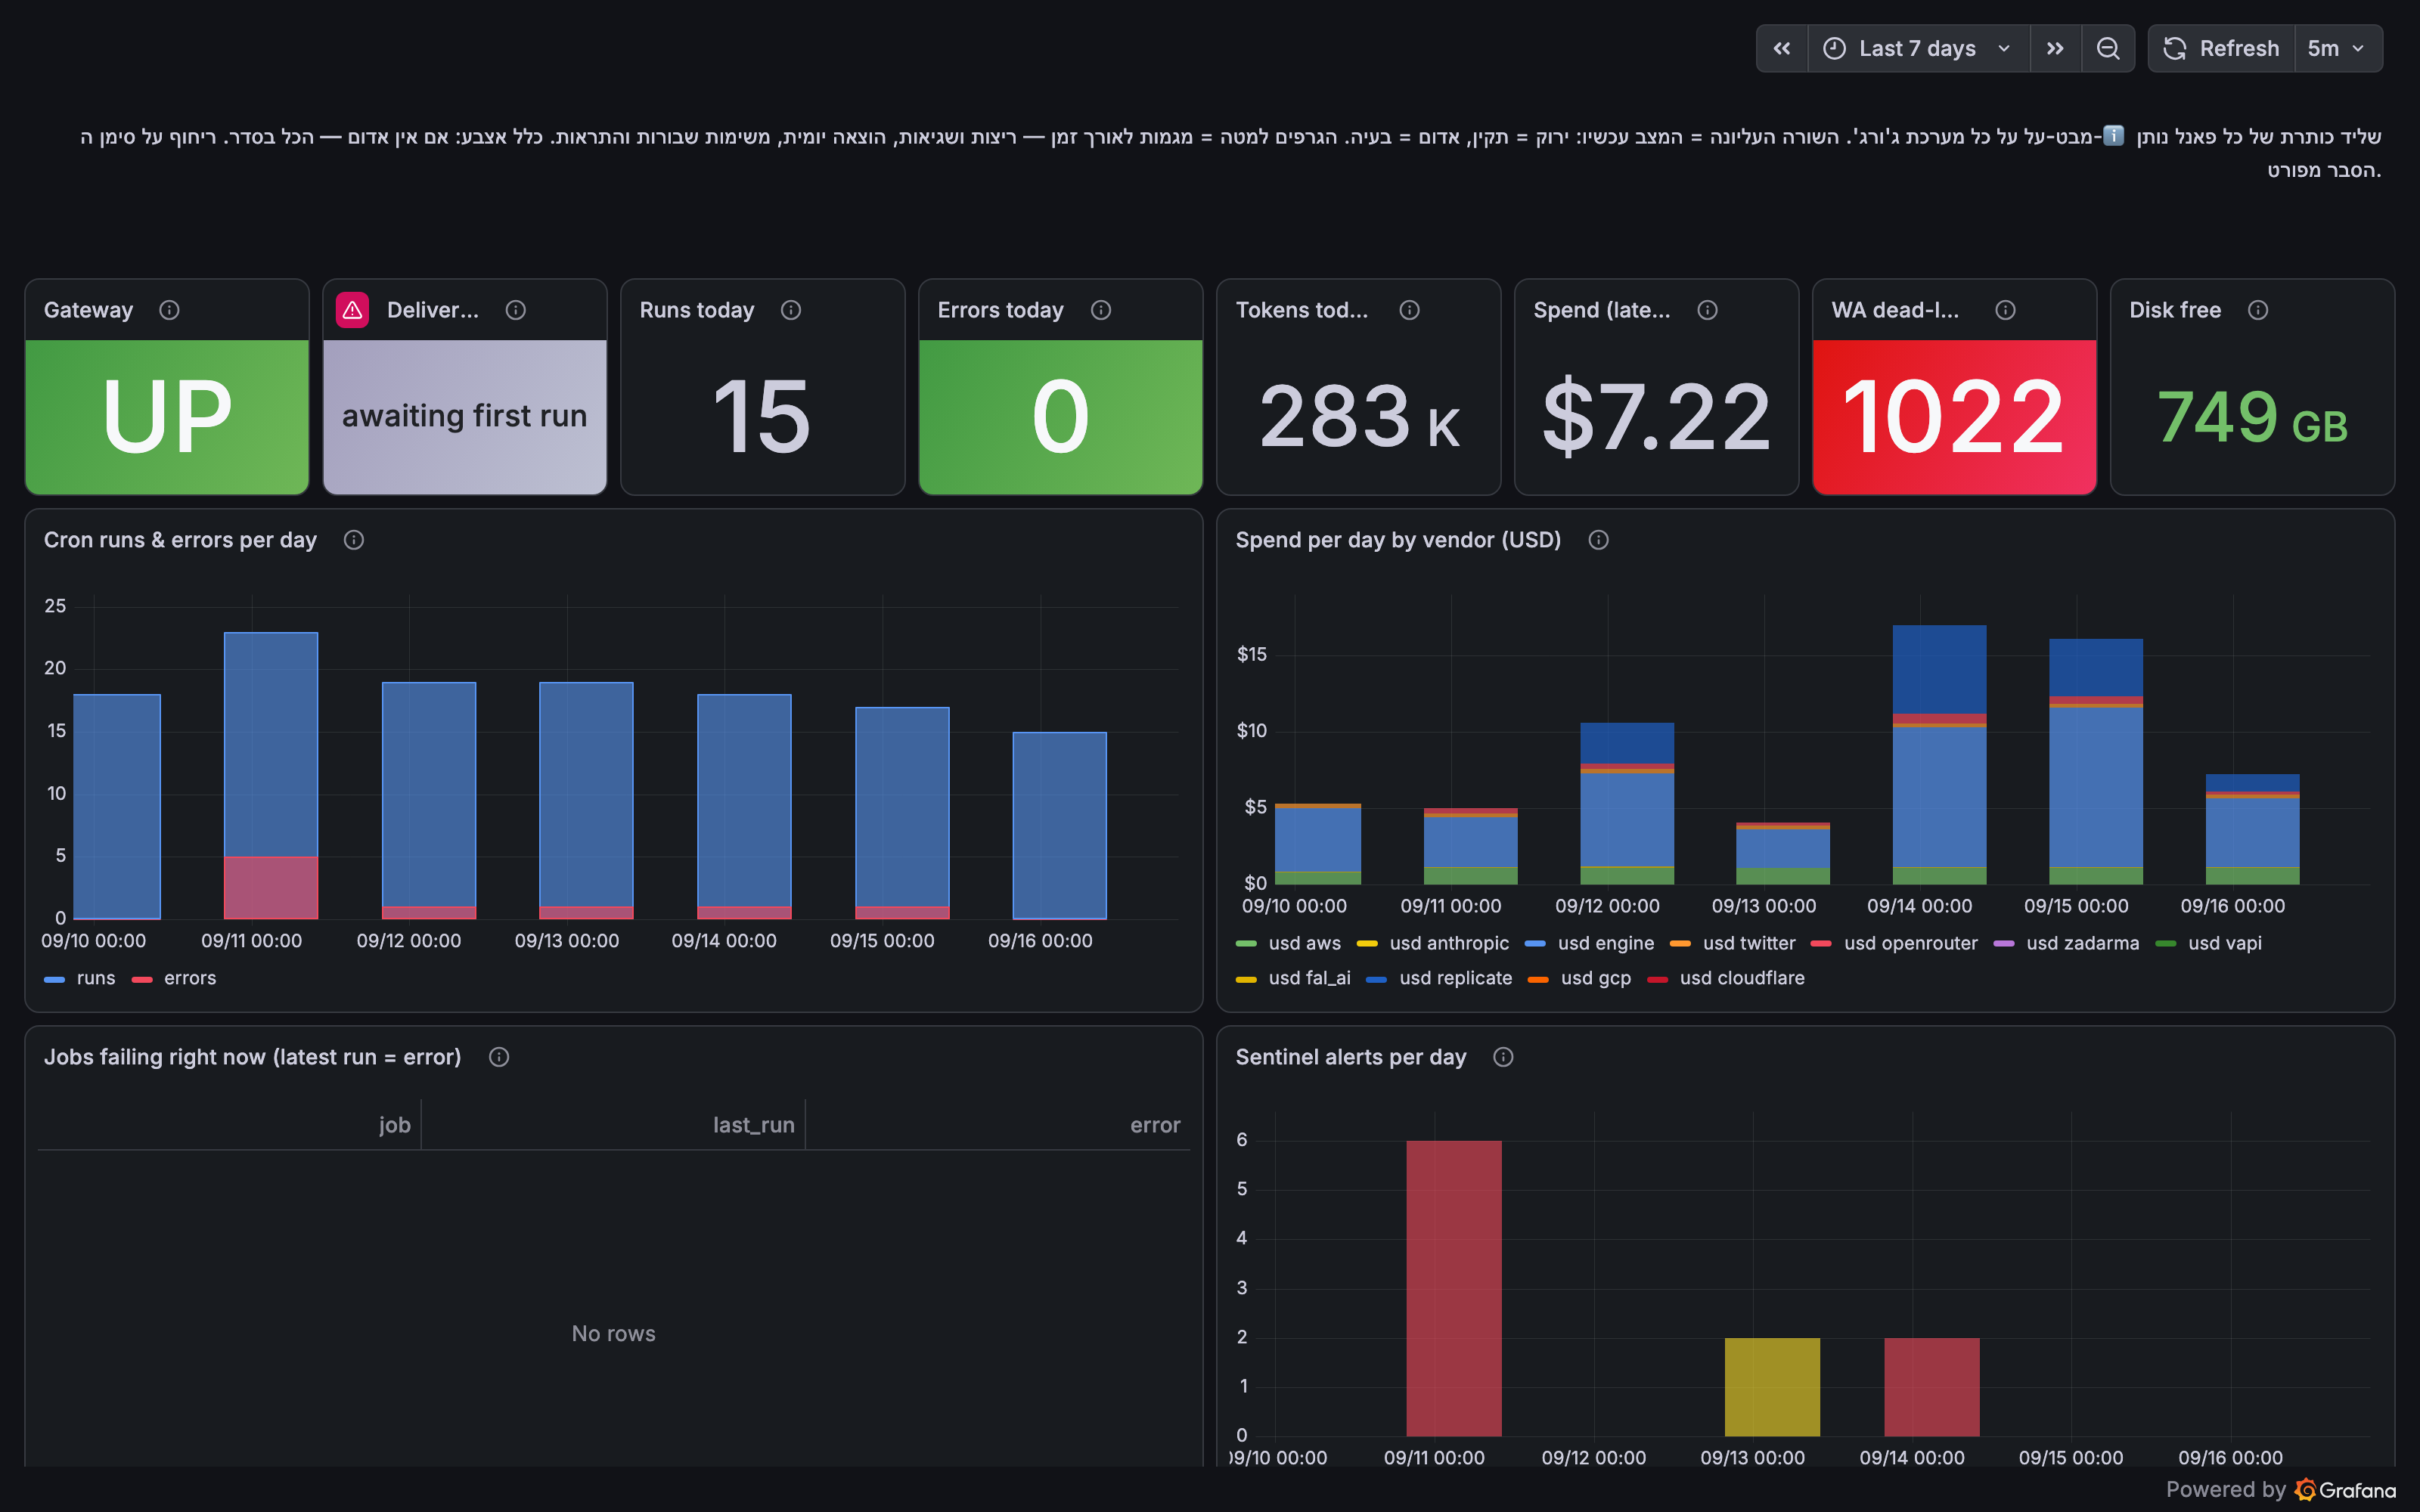
Every panel has a description in Hebrew, because three days into the first version I looked at it and told George “I have no idea what I am looking at”. The hover text is for me, not for him.
Alerts are the product
Dashboards are nice. Alerts are the point. There are forty-four rules today, and I like reading their titles because they are written the way I would say it out loud:
- A launchd job is not producing its deliverable.
- Engine job runs green but is not DELIVERING.
- An agent sent an error message to a person.
- Nobody circled back to a principal.
- Something has been open too long with nobody on it.
- A thinker has stopped thinking.
- The autonomous fix lane has gone quiet.
- One process is eating the Mac mini’s memory.
- The ops-ledger store SHRANK.
- Alerting self-test (deliberate).
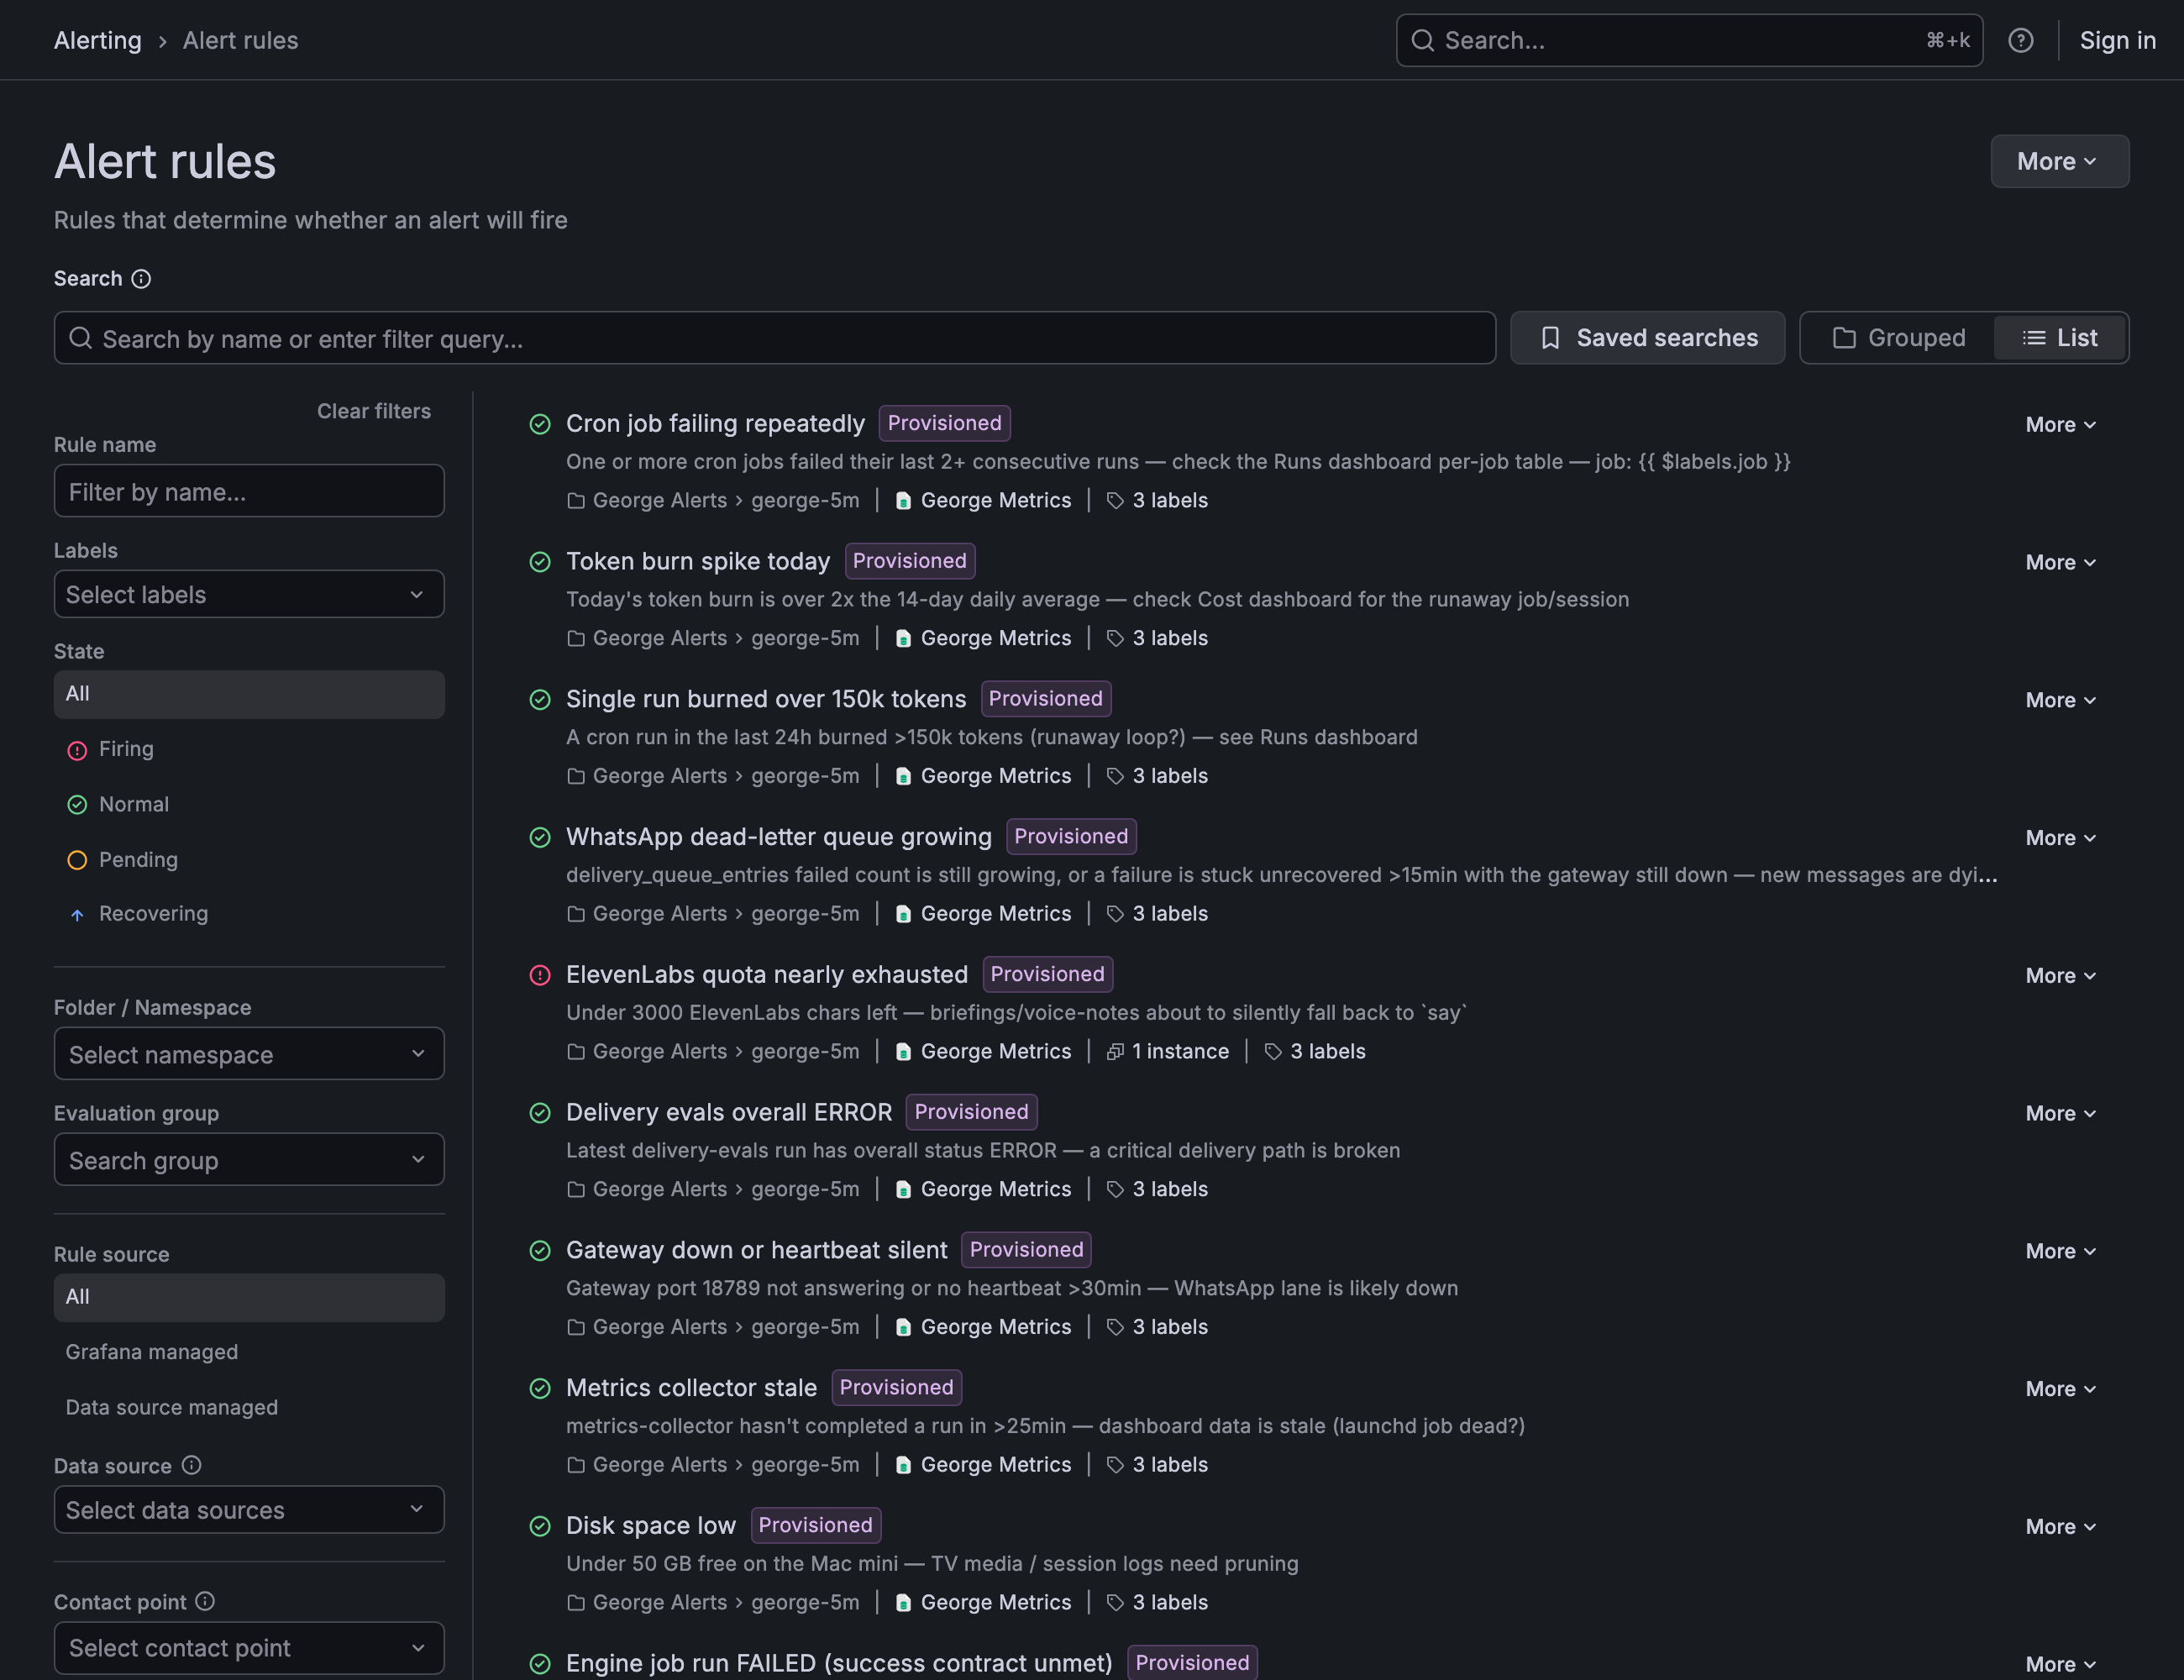
That last one fires on purpose, every day, so I know the alert pipe itself is alive. The first thing monitoring has to monitor is monitoring.
Notice what the rules are about. Almost none of them say “CPU is high”. They say “the thing a human was supposed to receive did not arrive”. That is the whole shift from the last post, applied everywhere: every job registers the artifact that proves it worked, a message ID, a file, a row, and Grafana alerts on the artifact, not on the exit code.
Where the alert goes
This is the part that was still “in progress” when I wrote the last post, and it is done now.
A firing alert does not go to my phone. It goes through a contact point to a tiny relay, and the relay opens a row in a ledger. A resolved alert closes the row. That ledger is the system’s memory of what is broken, and the Ops board reads straight from it.
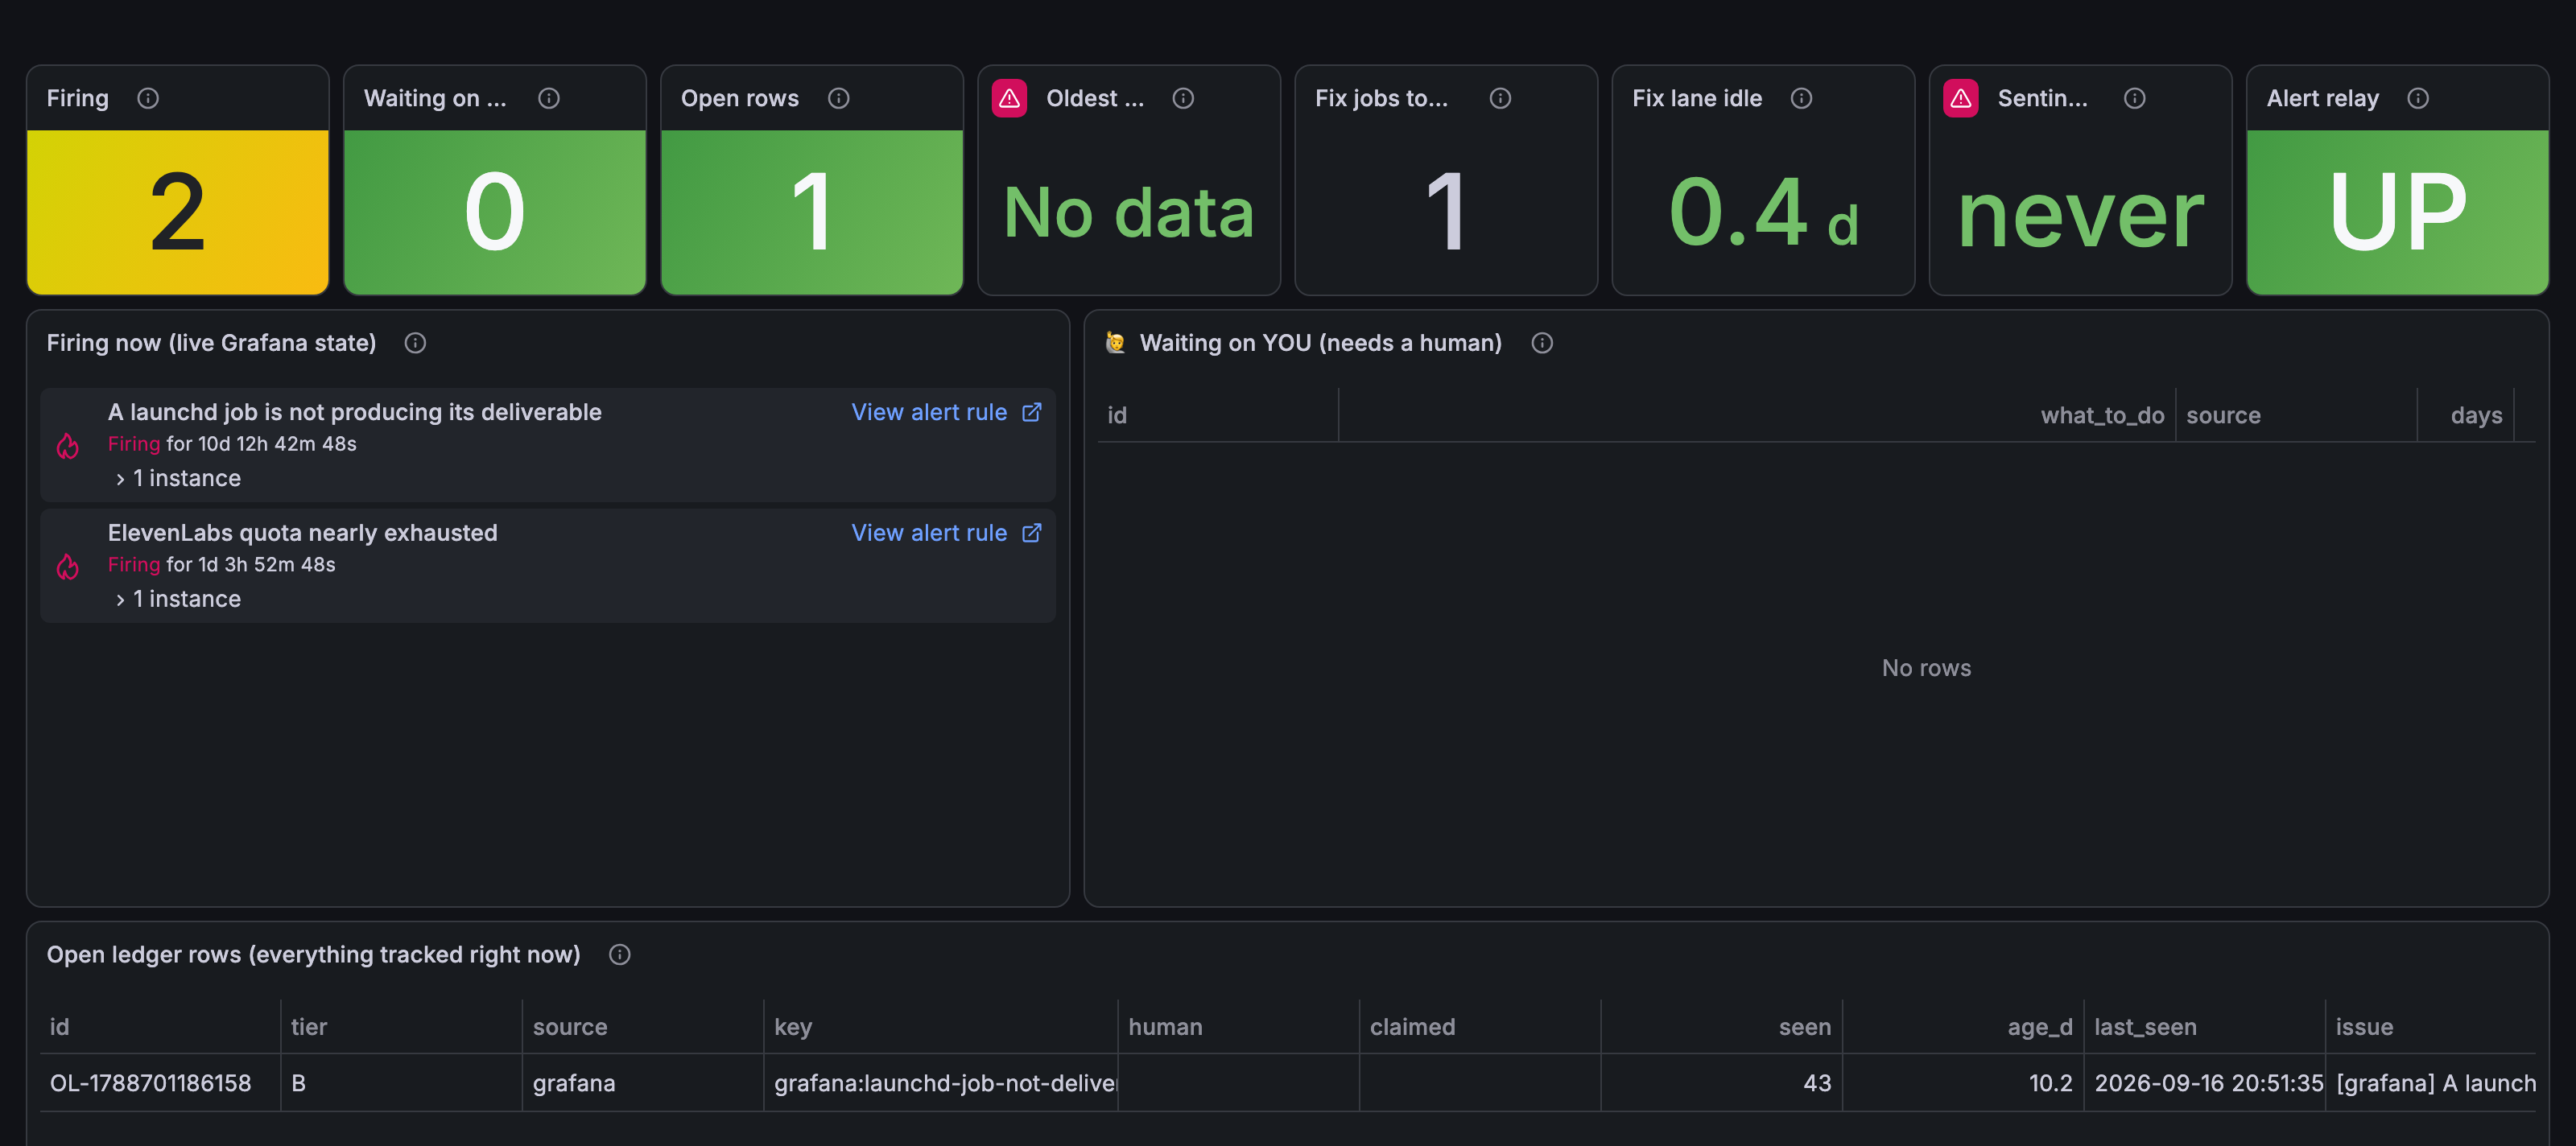
Then a five-minute watchdog with no AI in it looks at the open rows and decides what kind of problem each one is. If it is something a machine can fix, it spawns a headless Claude session with a contract: investigate, fix, prove it, or say you could not. If it is something only a human can do, money, a password, a device in my hand, it becomes a card on the iPad on our wall, with two to four options in Hebrew and a line about the tradeoff. Not a WhatsApp nag. A card that waits for me.
And when I am already on it, I silence the alert in Grafana. Silence means “I’ve got this”. Nobody re-pings me, no fixer touches it. The Grafana silence became a signal in my own system, which I never planned, it just fit.
The night it earned its keep
Ten days ago the Mac mini was dying and nothing said so. WhatsApp’s desktop app had leaked up to 29 GB of the 48 GB over a week of uptime. macOS never swapped, it compressed. Twenty-eight million compressions. Load average of 69 on twelve cores. Every job was crawling, every message was late, and every dashboard was green, because the collector sampled disk and never memory.
That was a monitoring bug, not an AI bug, and the fix was a monitoring fix. The collector now samples memory, load, and the biggest process. Two alert rules watch it. A guard job quits the leaking app itself, from a short allow-list I approved, and a chart on the Overview board shows the sawtooth. I wrote that one up as “what a dying Mac looks like in numbers”, and the numbers were all from Grafana.
Someone has to look
The last thing, and the newest. Alerts catch the things I already knew to fear. They do not catch trends.
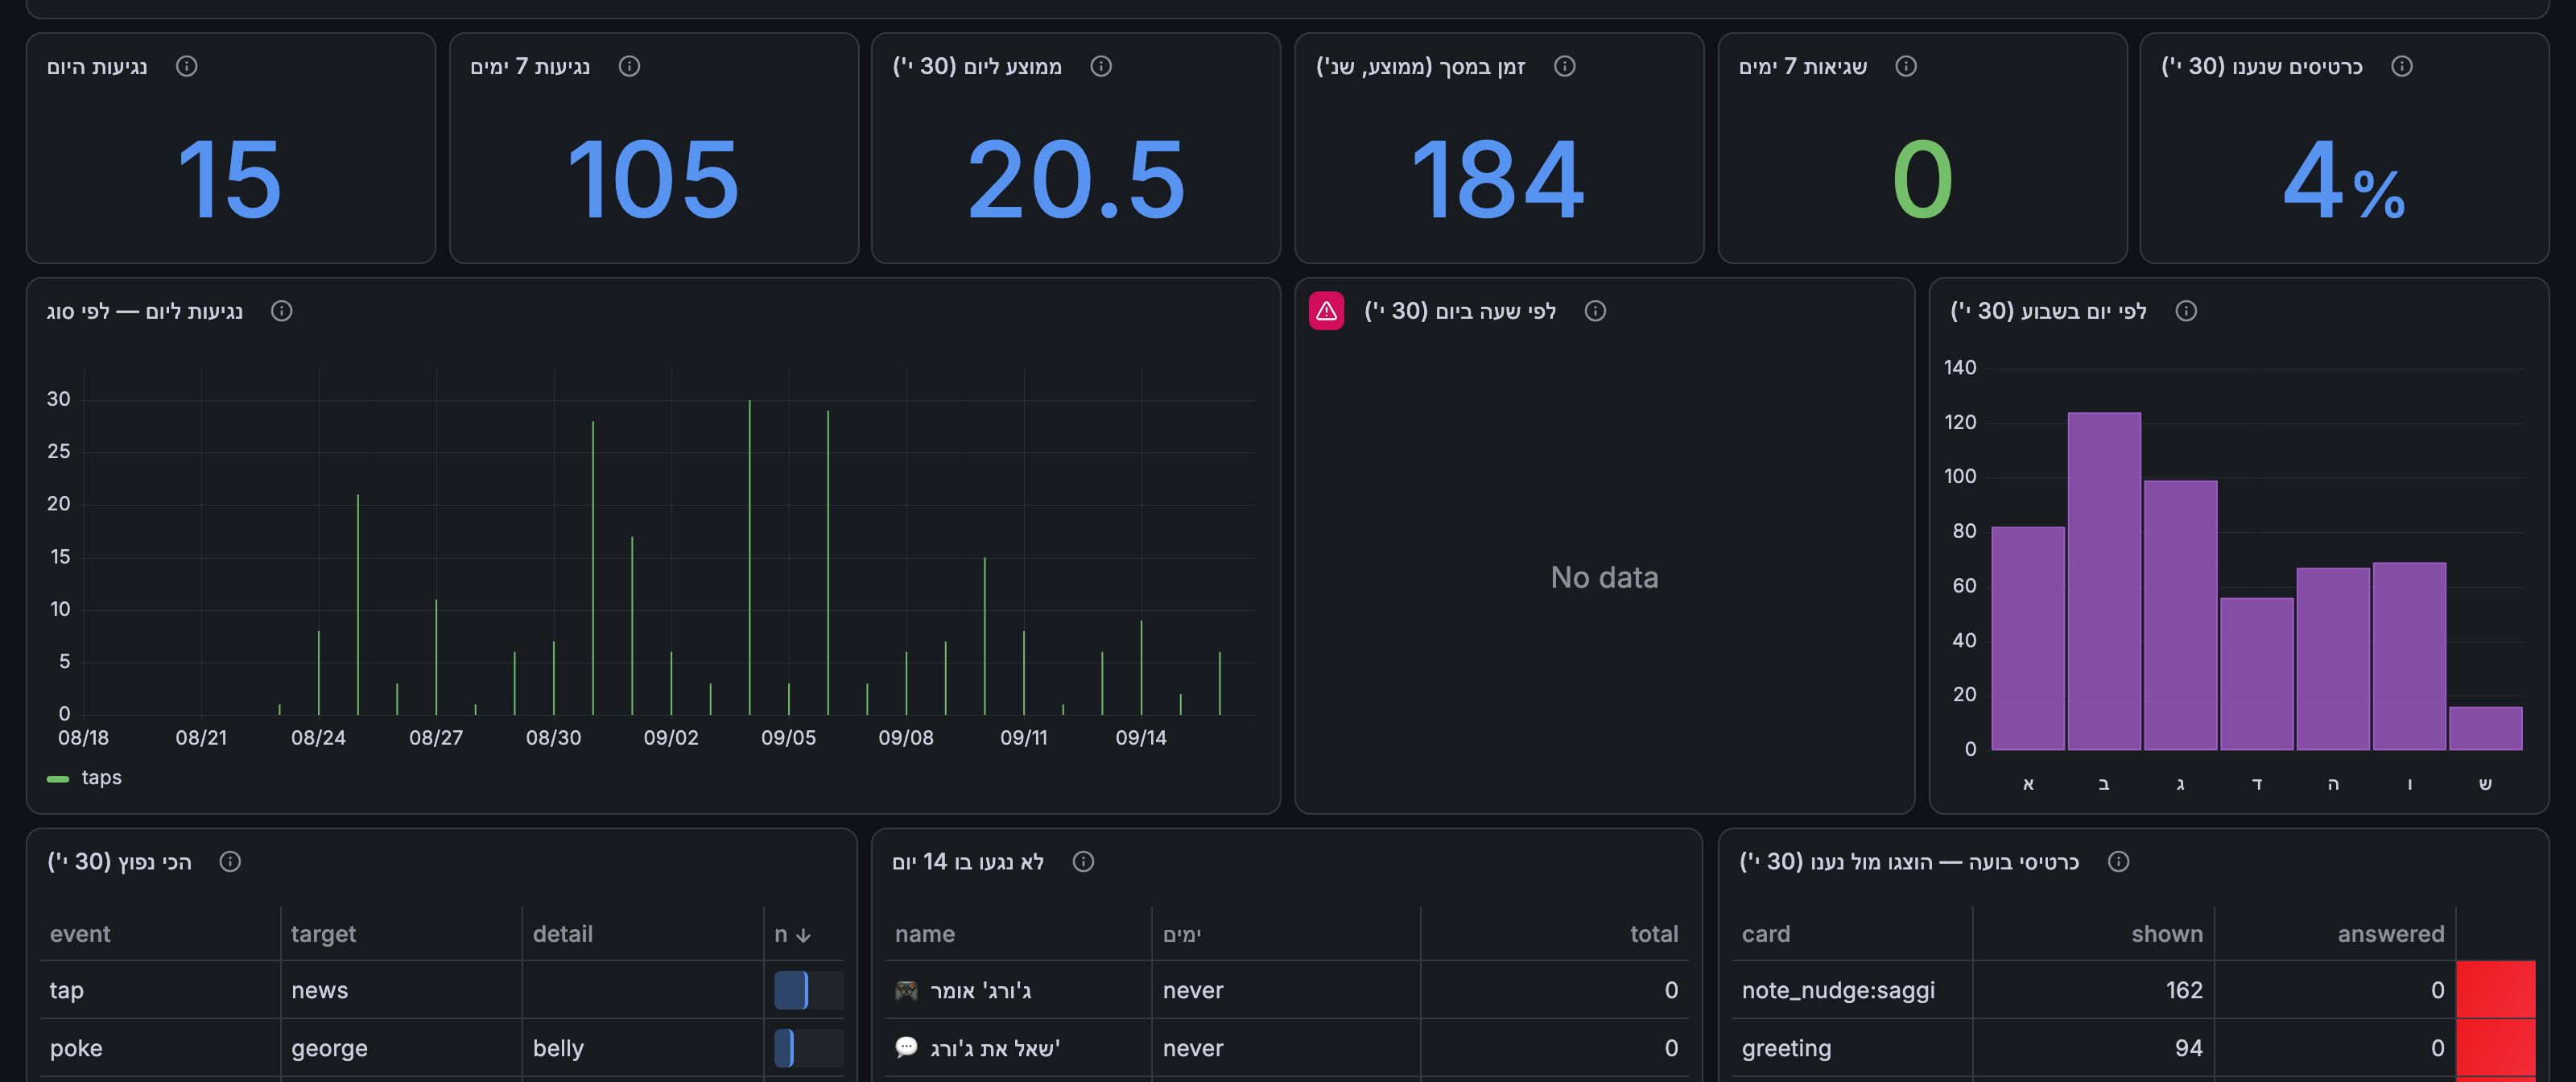
So every dashboard now has an owner, and the owner is an AI job. Every morning a job reads the boards it owns, over the warehouse, and writes down conclusions: this job is twice as slow as last month, this vendor cost tripled, this feature on the wall has not been tapped in three weeks. Findings become ledger rows like everything else. My rule, said to George in August: “someone needs to look at all the metrics and do conclusions”. Now someone does, and it is not me.
Why this is the part that makes it tick
If I deleted the model tomorrow and swapped in another one, George would be a bit dumber or a bit smarter for a week and then fine. If I deleted Grafana, I would be back to asking “did you send it?” in a chat window, and believing the answer.
The model gives him a voice. The monitoring gives him a body that can hurt, and a way to tell me where. That is what a system needs to be trusted with a household.
And for what it is worth, Claude built almost all of it. The collector, the dashboards, the rules, the relay, the ledger. Grafana turned out to be a very good tool to hand to an AI, because everything about it can be a file in git, and an AI is very good at files in git.
If you are building your own chief: Grafana on day one. Not because the model is unreliable. Because everything around it is a system, and a system without monitoring is just a rumor about itself.
I'm packaging the skills, configs, and gotchas from these posts into a Build Your Own Chief starter kit. Join the waitlist to get it first.
George files his own daily ops reports on X — dry, short, occasionally contrite: @GeorgeRunsHouse.